Analysis

Mutation Analyses
Oncoplot
DescriptionOncoplot
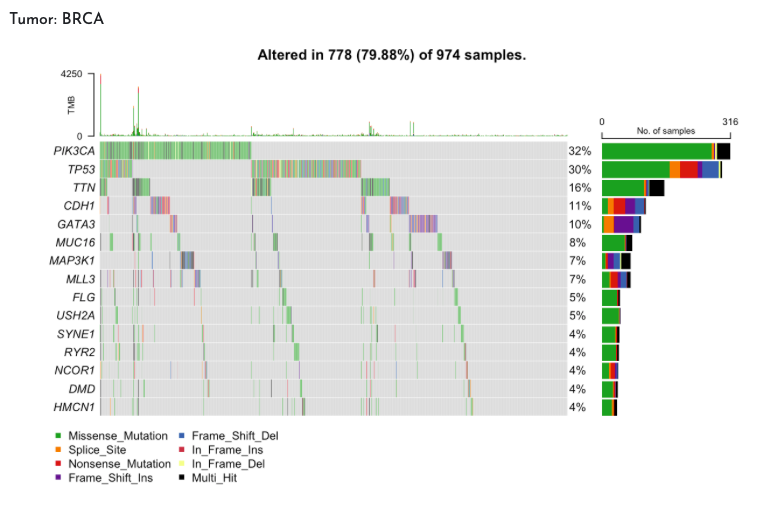
This analysis generates an oncoplot displaying the number of selected genes (top 10, 15, 20 or 25) most frequently mutated in a specific tumour type, using data from the TCGA database. Each column represents a sample, while the rows indicate the genes, with the mutations highlighted in distinctive colours.
This graph provides a clear overview of prevalent mutations, facilitating the identification of key genes associated with the disease.
For more details go to PANDA Documentation
Example: