Analysis

Transcriptomic Analyses
Differential Expression Analysis Single Tumor
Differential Expression Analysis Single Tumor
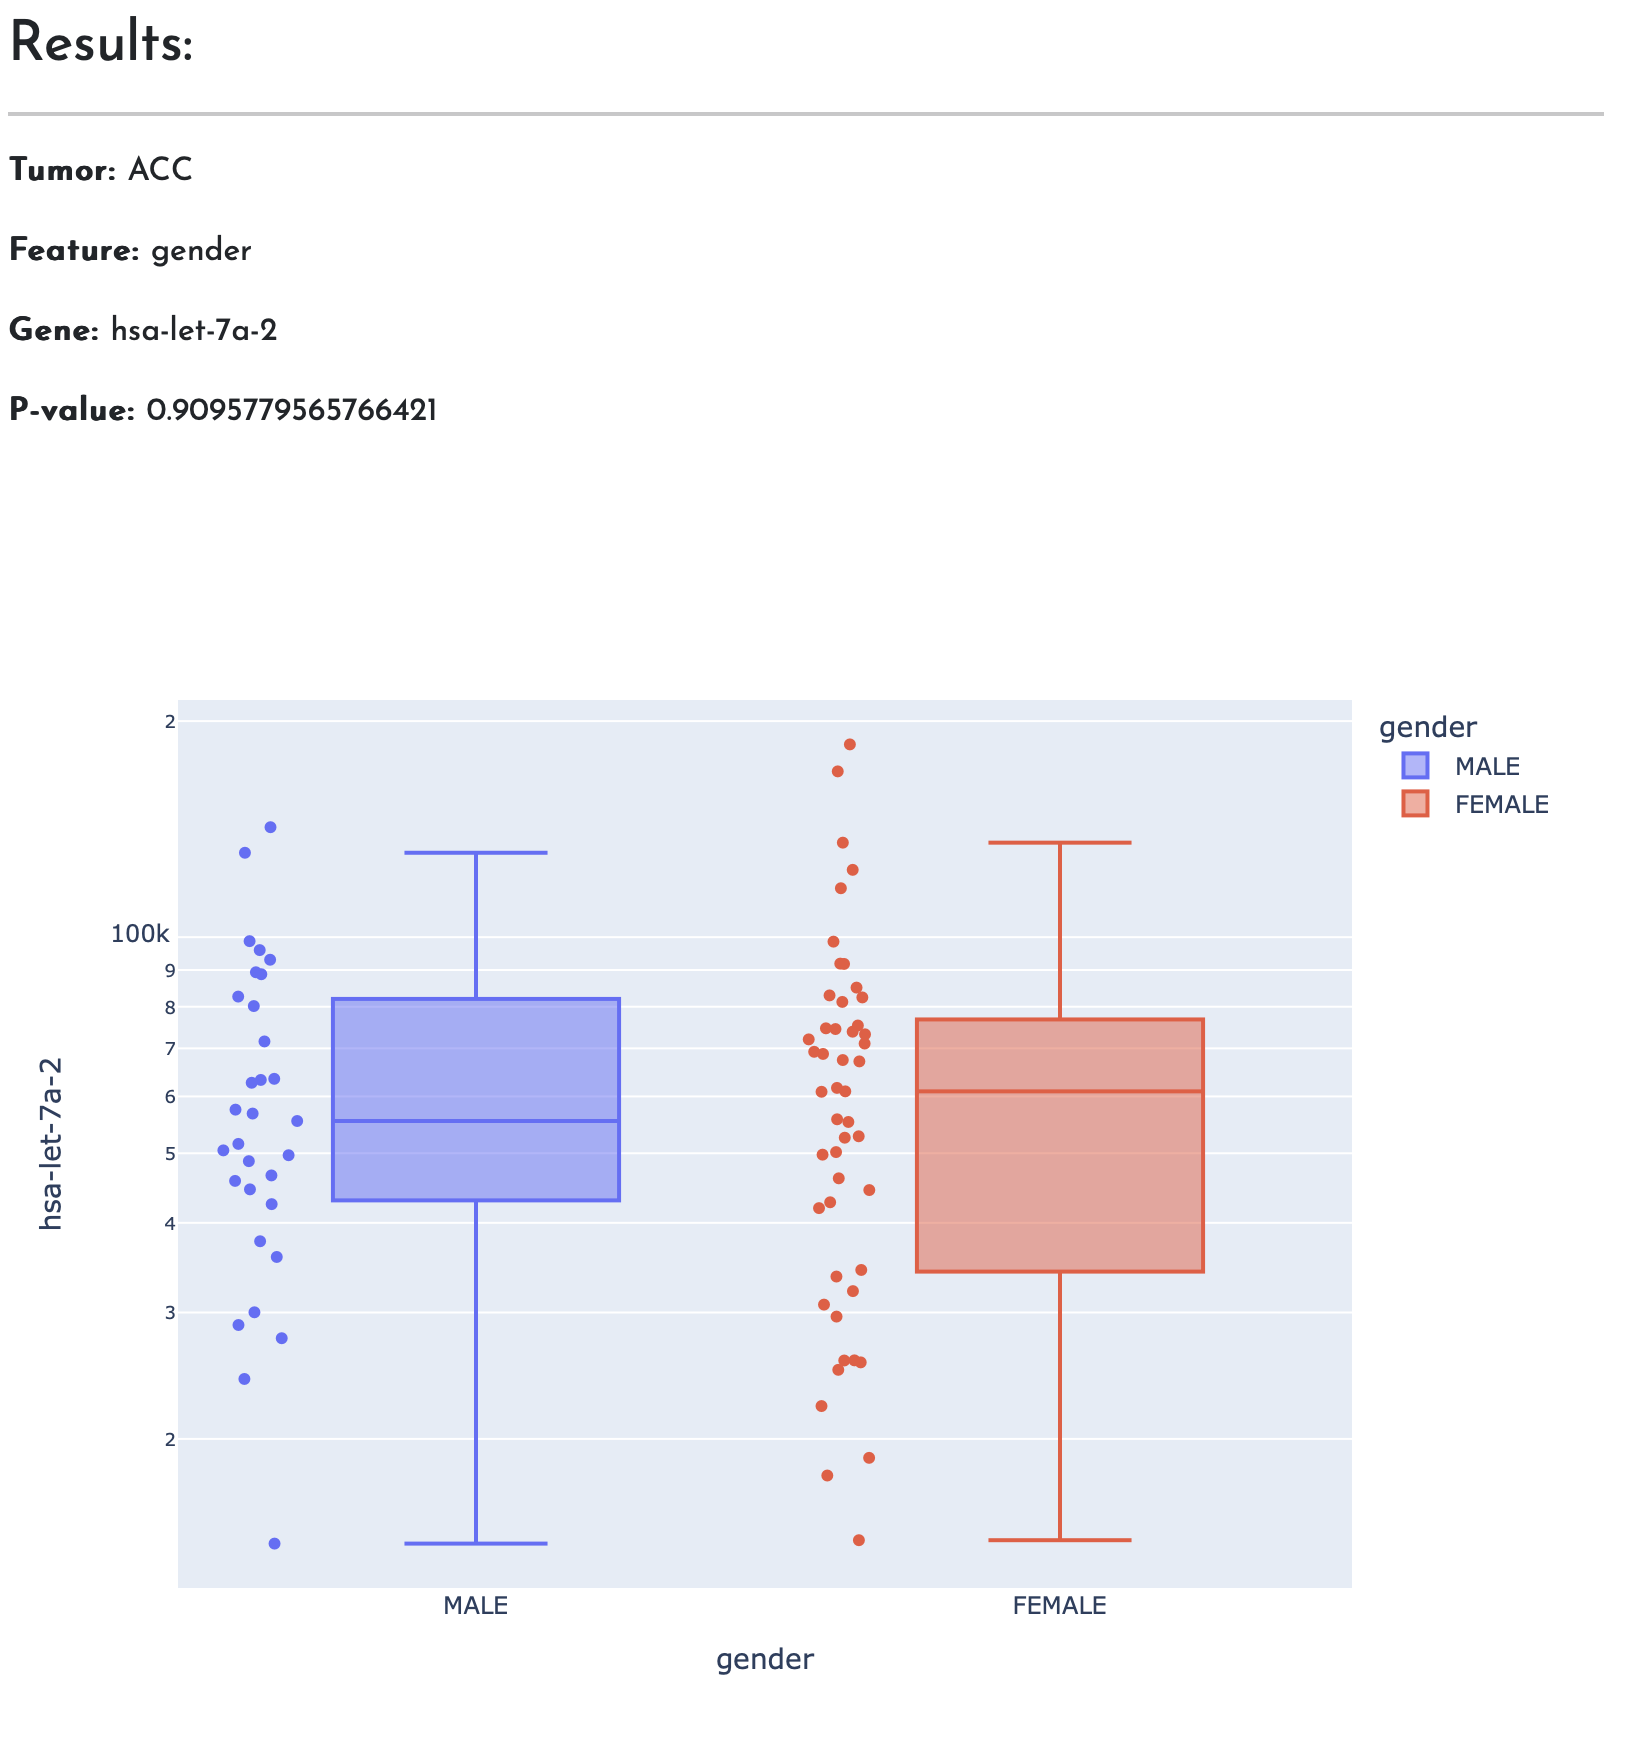
This analysis allows users to explore differences in the expression of a gene or miRNA between patients in two distinct conditions (based on the selected feature) within a given tumor type. The analysis leverages TCGA Gene Expression Quantification data (FPKM, normalized counts) to assess these differences.
The results are visualized in a box plot, where the x-axis represents the two conditions under comparison (e.g., male vs. female), and the y-axis displays the expression levels of the specified gene or miRNA.
A p-value, calculated using the Wilcoxon test, quantifies the significance of the observed expression differences between the two groups.
For more details go to PANDA Documentation
Example: