Analysis

Proteomic Analyses
Differential Expression Analysis Single Tumor
Differential Expression Analysis Single Tumor
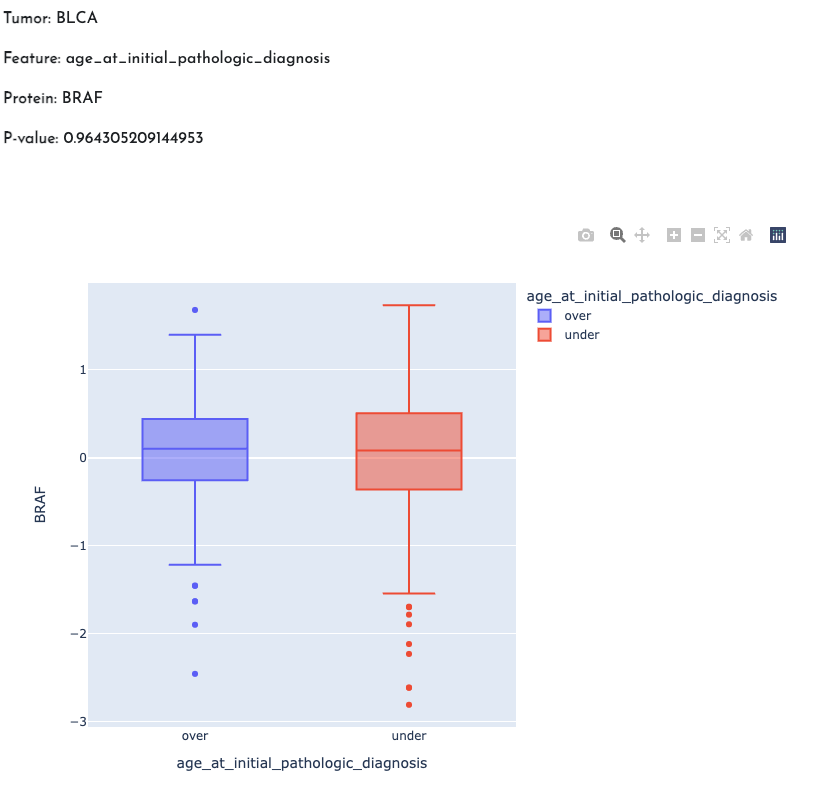
This analysis allows users to explore differences in the expression of protein between patients in two distinct conditions (based on the selected feature) within a given tumor type.
The results are visualized in a box plot, where the x-axis represents the two conditions under comparison (e.g., male vs. female), and the y-axis displays the expression levels of the specified protein. P-value, calculated using the Wilcoxon test, quantifies the significance of the observed expression differences between the two groups.
For more details go to PANDA Documentation
Example: