Analysis

Transcriptomic Analyses
DESeq2: Differential Expression Analysis
DescriptionDESeq2: Differential Expression Analysis
The differential expression analysis performed with DESeq2 uses data from the TCGA Gene Expression Quantification HTSeq - counts. This analysis is based on the negative binomial distribution to identify differentially expressed genes.
All DESeq2 analyses provided by this web server are precomputed, ensuring that users do not need to spend time on computationally intensive tasks. This significantly reduces the time required to obtain results.
To perform the analysis
- Select the tumor of interest
- Press the search button "Features"
- This will display in the second select all the features for which it is possible to obtain the result of this analysis for that specific tumor.
- Pressing "Submit" will display the results with graphs and related information of the data entered by the user.
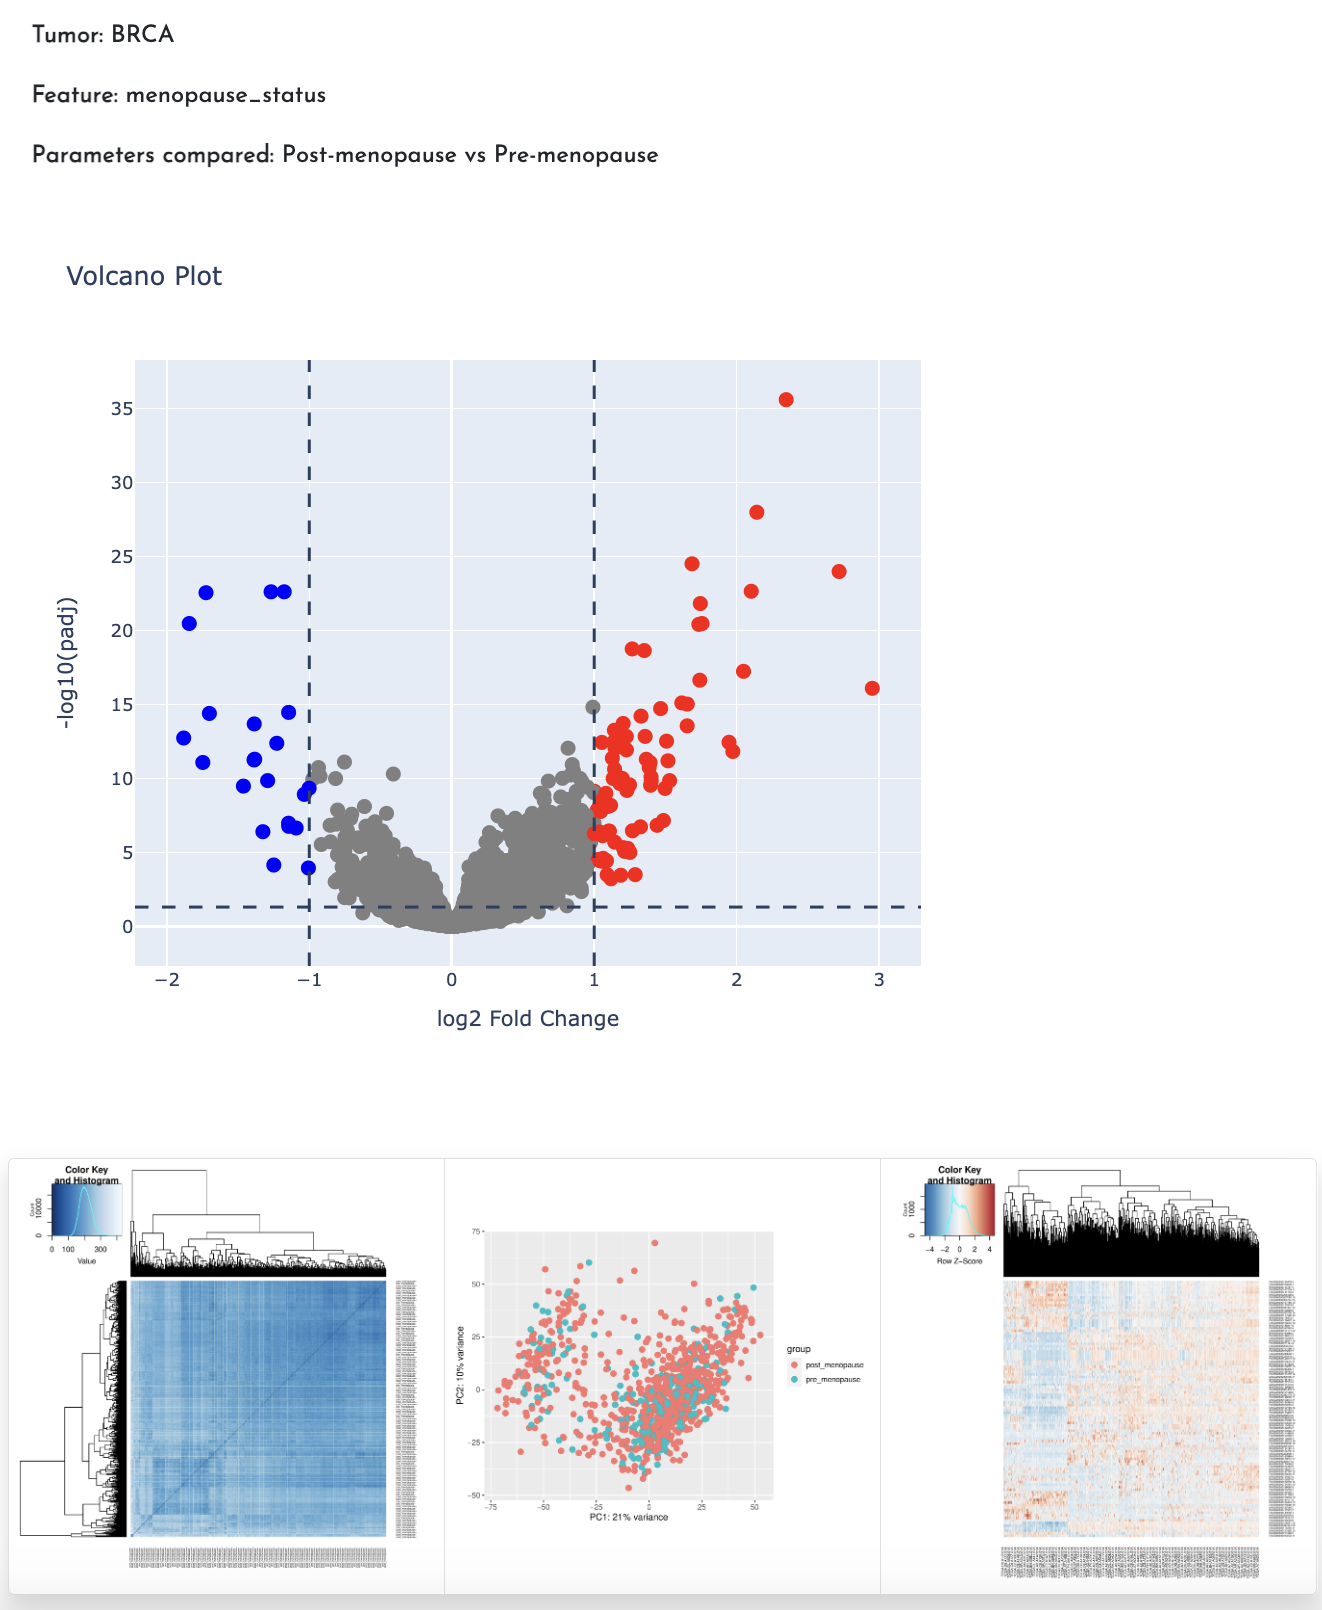
A key detail provided in the results is the comparison of parameters, specifically the order in which the feature parameters are compared (e.g., Tumor vs. Control).
The analysis results in a downloadable table that includes:
- Log2 Fold Change: The calculated fold change between conditions.
- p-value: The statistical significance of the differential expression.
- Adjusted p-value (padj):The p-value adjusted for multiple testing to control the false discovery rate.
In addition, several graphs such as Enhanced Volcano Plot, Heatmap, PCA and Heatmap top 100 can be viewed and downloaded.
For more details go to PANDA Documentation
Example: