Analysis

Proteomic Analyses
Pan-Cancer Differential Expression Analysis
Pan-Cancer Differential Expression Analysis
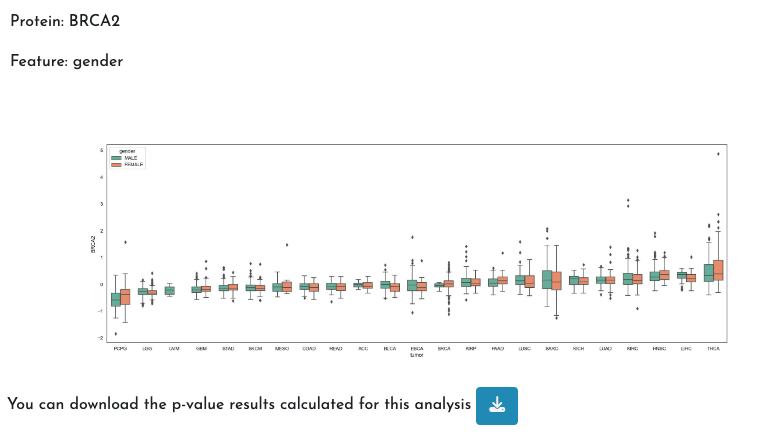
This analysis evaluates the differential expression of a protein under two conditions across all tumors for which data on the selected feature is available. It provides an overview of protein varies across different tumor types.
On the x-axis, the available tumor types are displayed, while the y-axis represents the expression levels of the gene, miRNA, or protein in each tumor type.
For more details go to PANDA Documentation
Example: