Analysis

Mutation Analyses
Tumor Mutation Analysis
DescriptionTumor Mutation Analysis
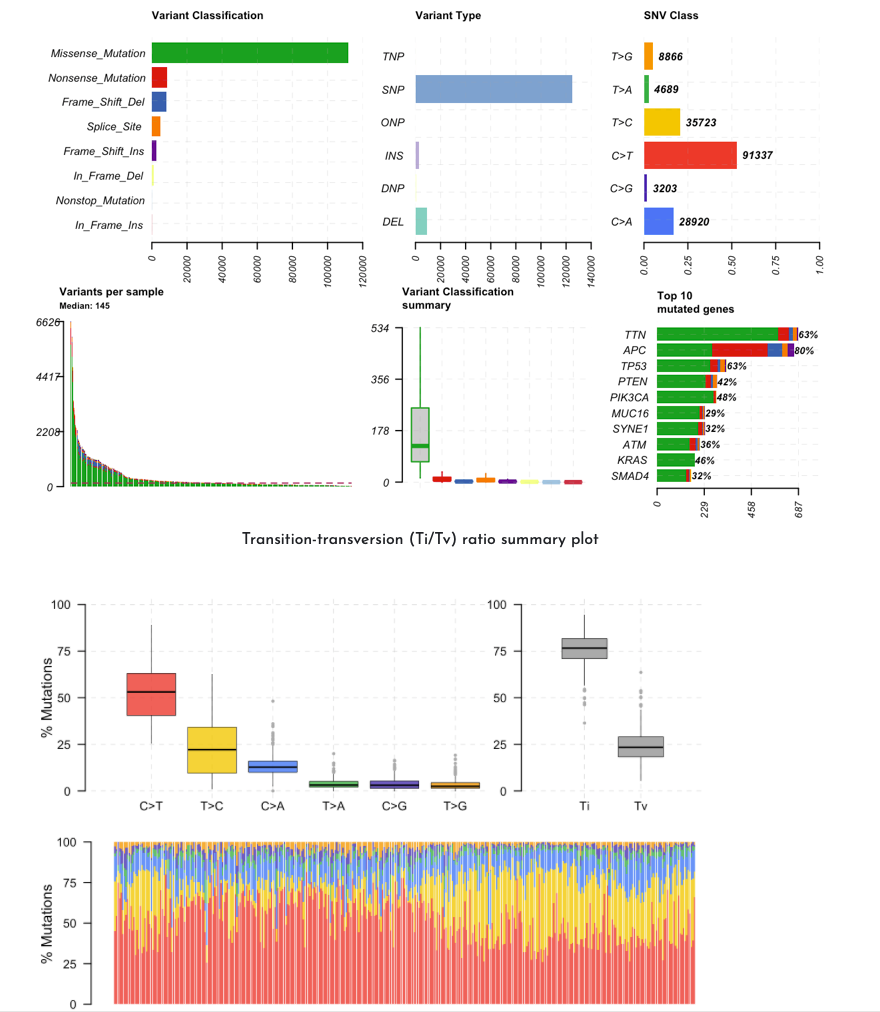
This analysis uses the maftools library to analyze genomic data of a specific tumour from the TCGA database. It generates a mutation summary image (maf summary) and a graph comparing mutation transitions and transversions (TiTv). Each graph provides a visual analysis of the mutations, highlighting key statistics and distributions characteristic of the selected tumor.
For more details go to PANDA Documentation
Example: