Analysis

Mutation Analyses
Gene Mutation Analysis
DescriptionGene Mutation Analysis
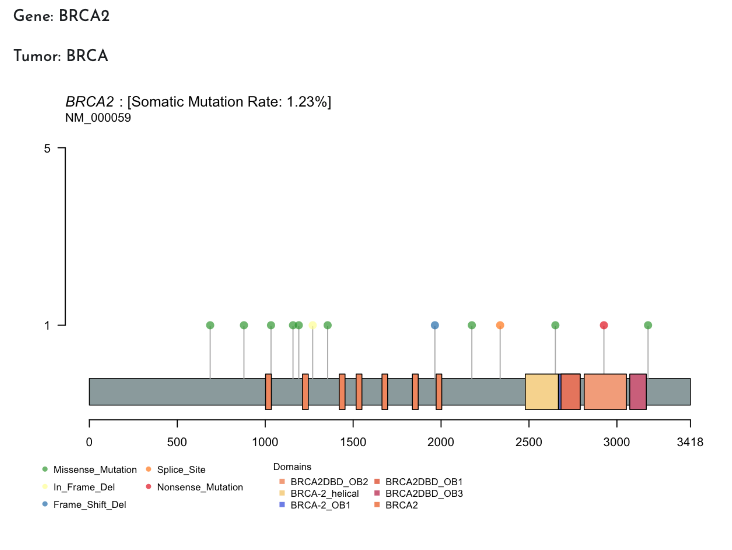
This analysis produces a lollipop graph using the maftools library to visualise mutations in a specific gene within a tumour selected from the TCGA genomic data. Mutations are annotated according to the Protein_Change column, which indicates the types of amino acid changes. The graph represents the frequency of mutations along the length of the gene, highlighting significant mutations at the corresponding points.
For more details go to PANDA Documentation
Example: